One template, many stories
Parameterized reports with 
2026-05-30
Problem n°1:
Image from “Enough Markdown to Write a Thesis” by Richard J. Telford (2025)
Solution: Quarto
Artwork from “Hello, Quarto” keynote by Julia Lowndes and Mine Çetinkaya-Rundel, presented at RStudio::Conf(2022). Illustrated by Allison Horst.
Quarto rendering
Artwork from “Hello, Quarto” keynote by Julia Lowndes and Mine Çetinkaya-Rundel, presented at RStudio::Conf(2022). Illustrated by Allison Horst.
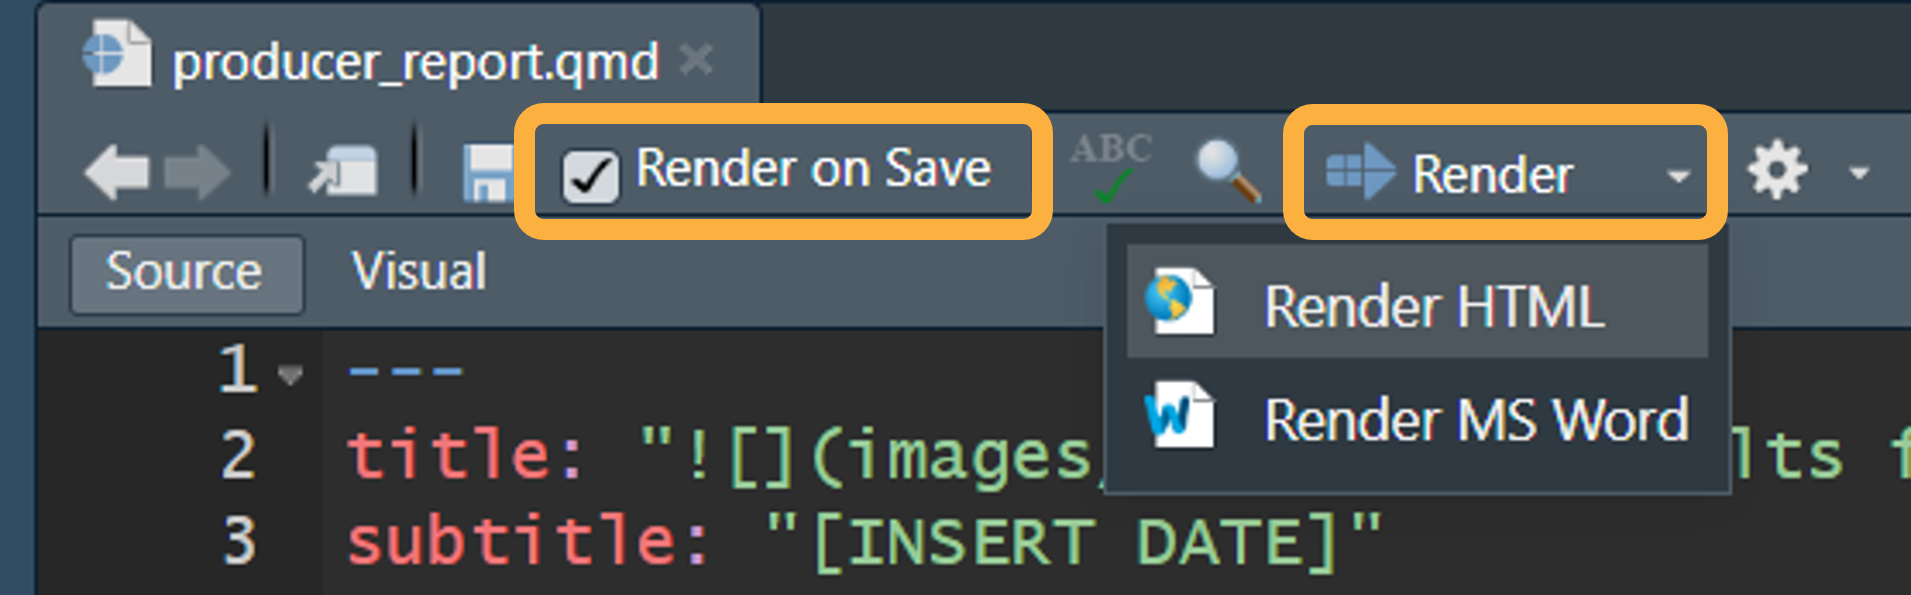
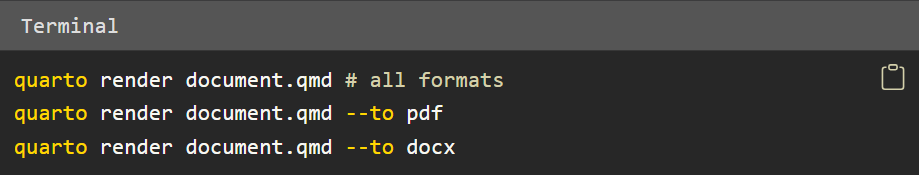
Render: press the button
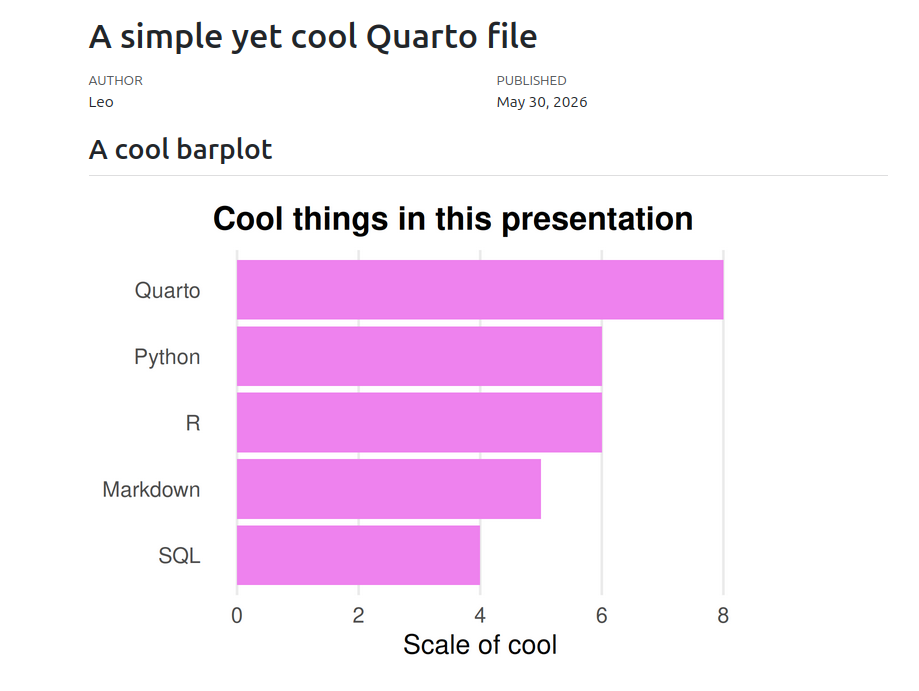
a simple quarto (.qmd) file in HTML
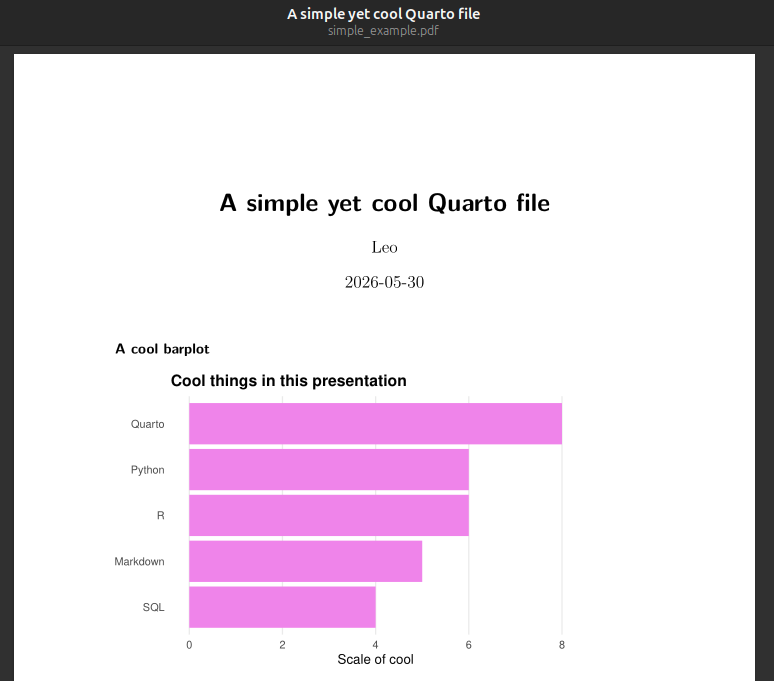
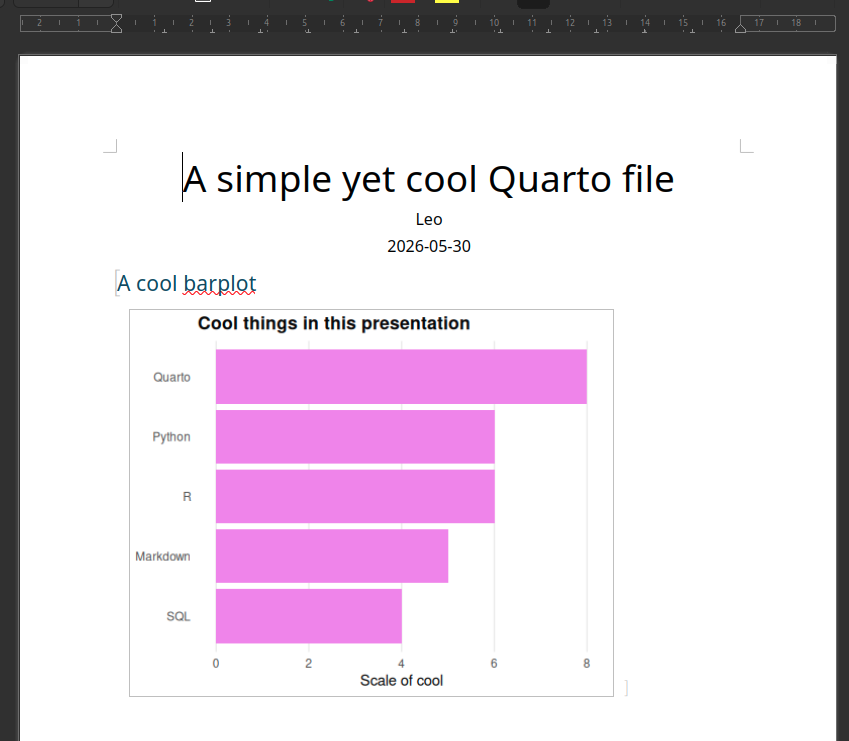
a simple quarto (.qmd) file in PDF
a simple quarto (.qmd) file in DOCX
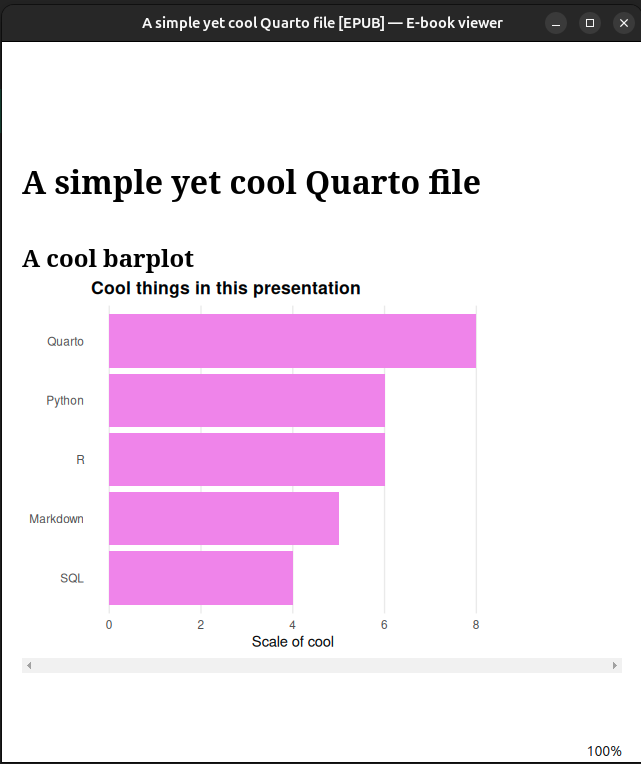
a simple quarto (.qmd) file in EPUB
Where we are now
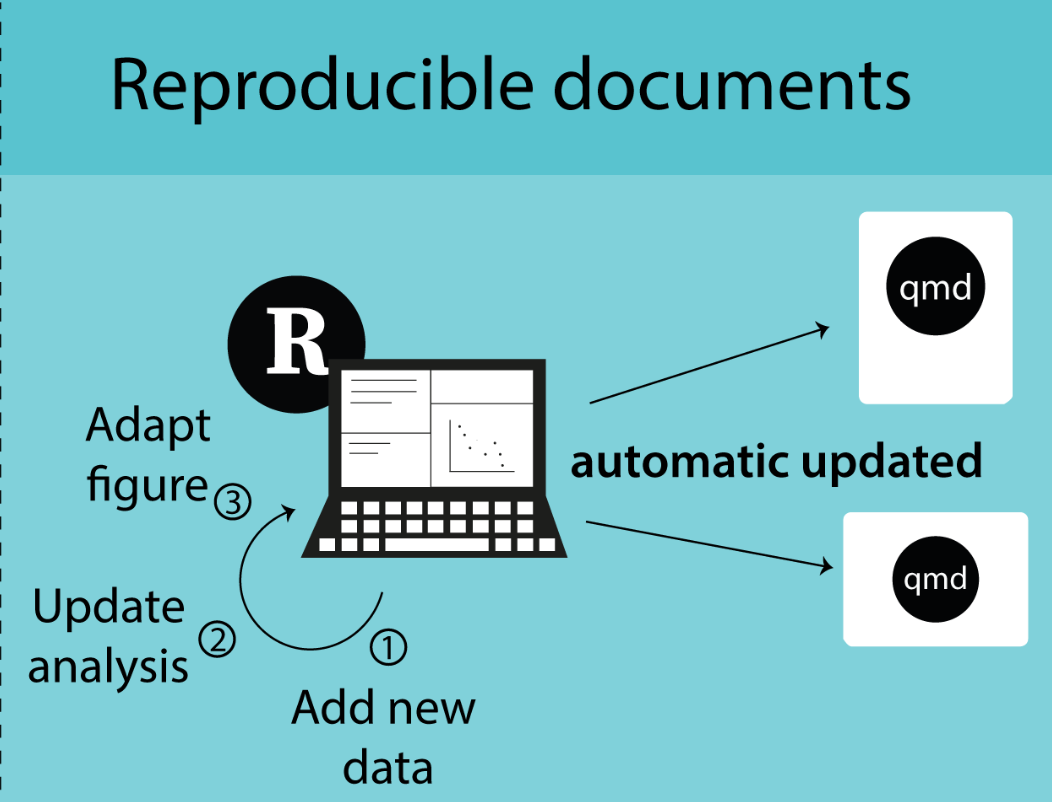
Image from “Enough Markdown to Write a Thesis” by Richard J. Telford (2025)
Mid-presentation conclusion: Quarto is cool

Problem n°2:
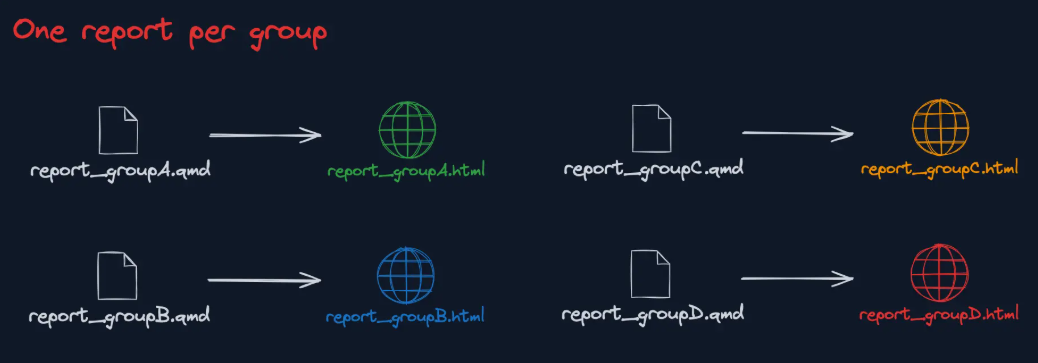
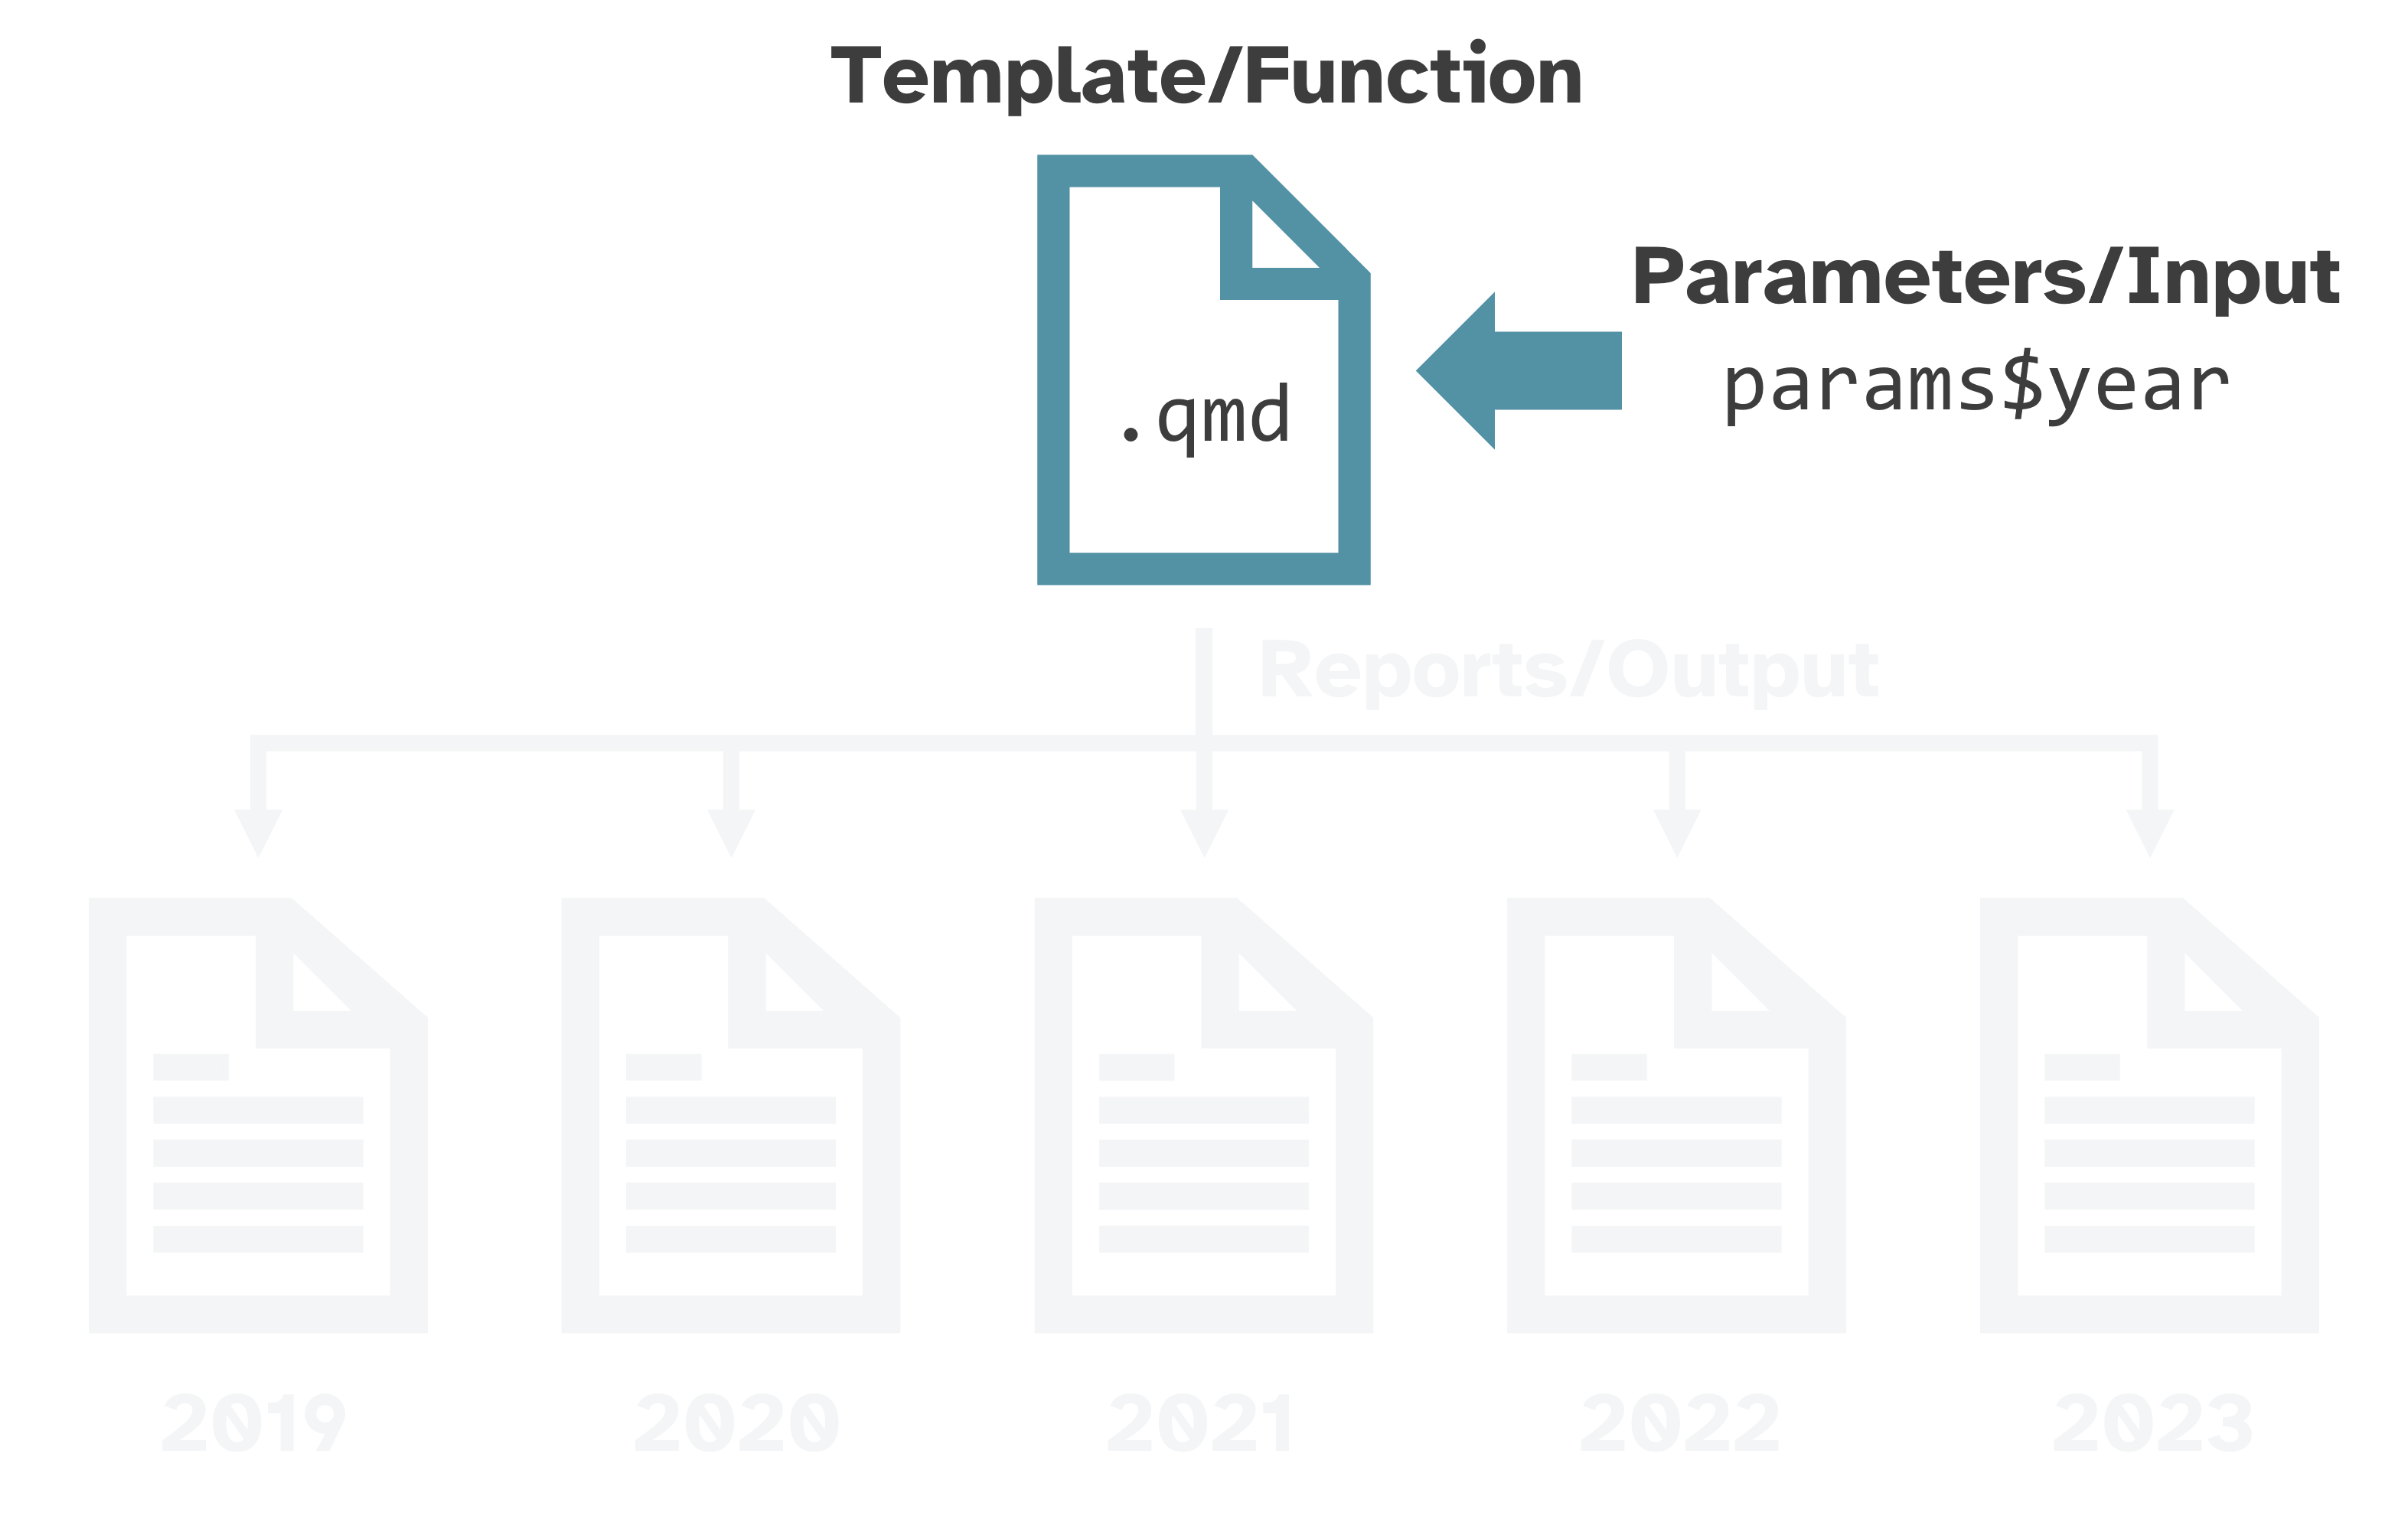
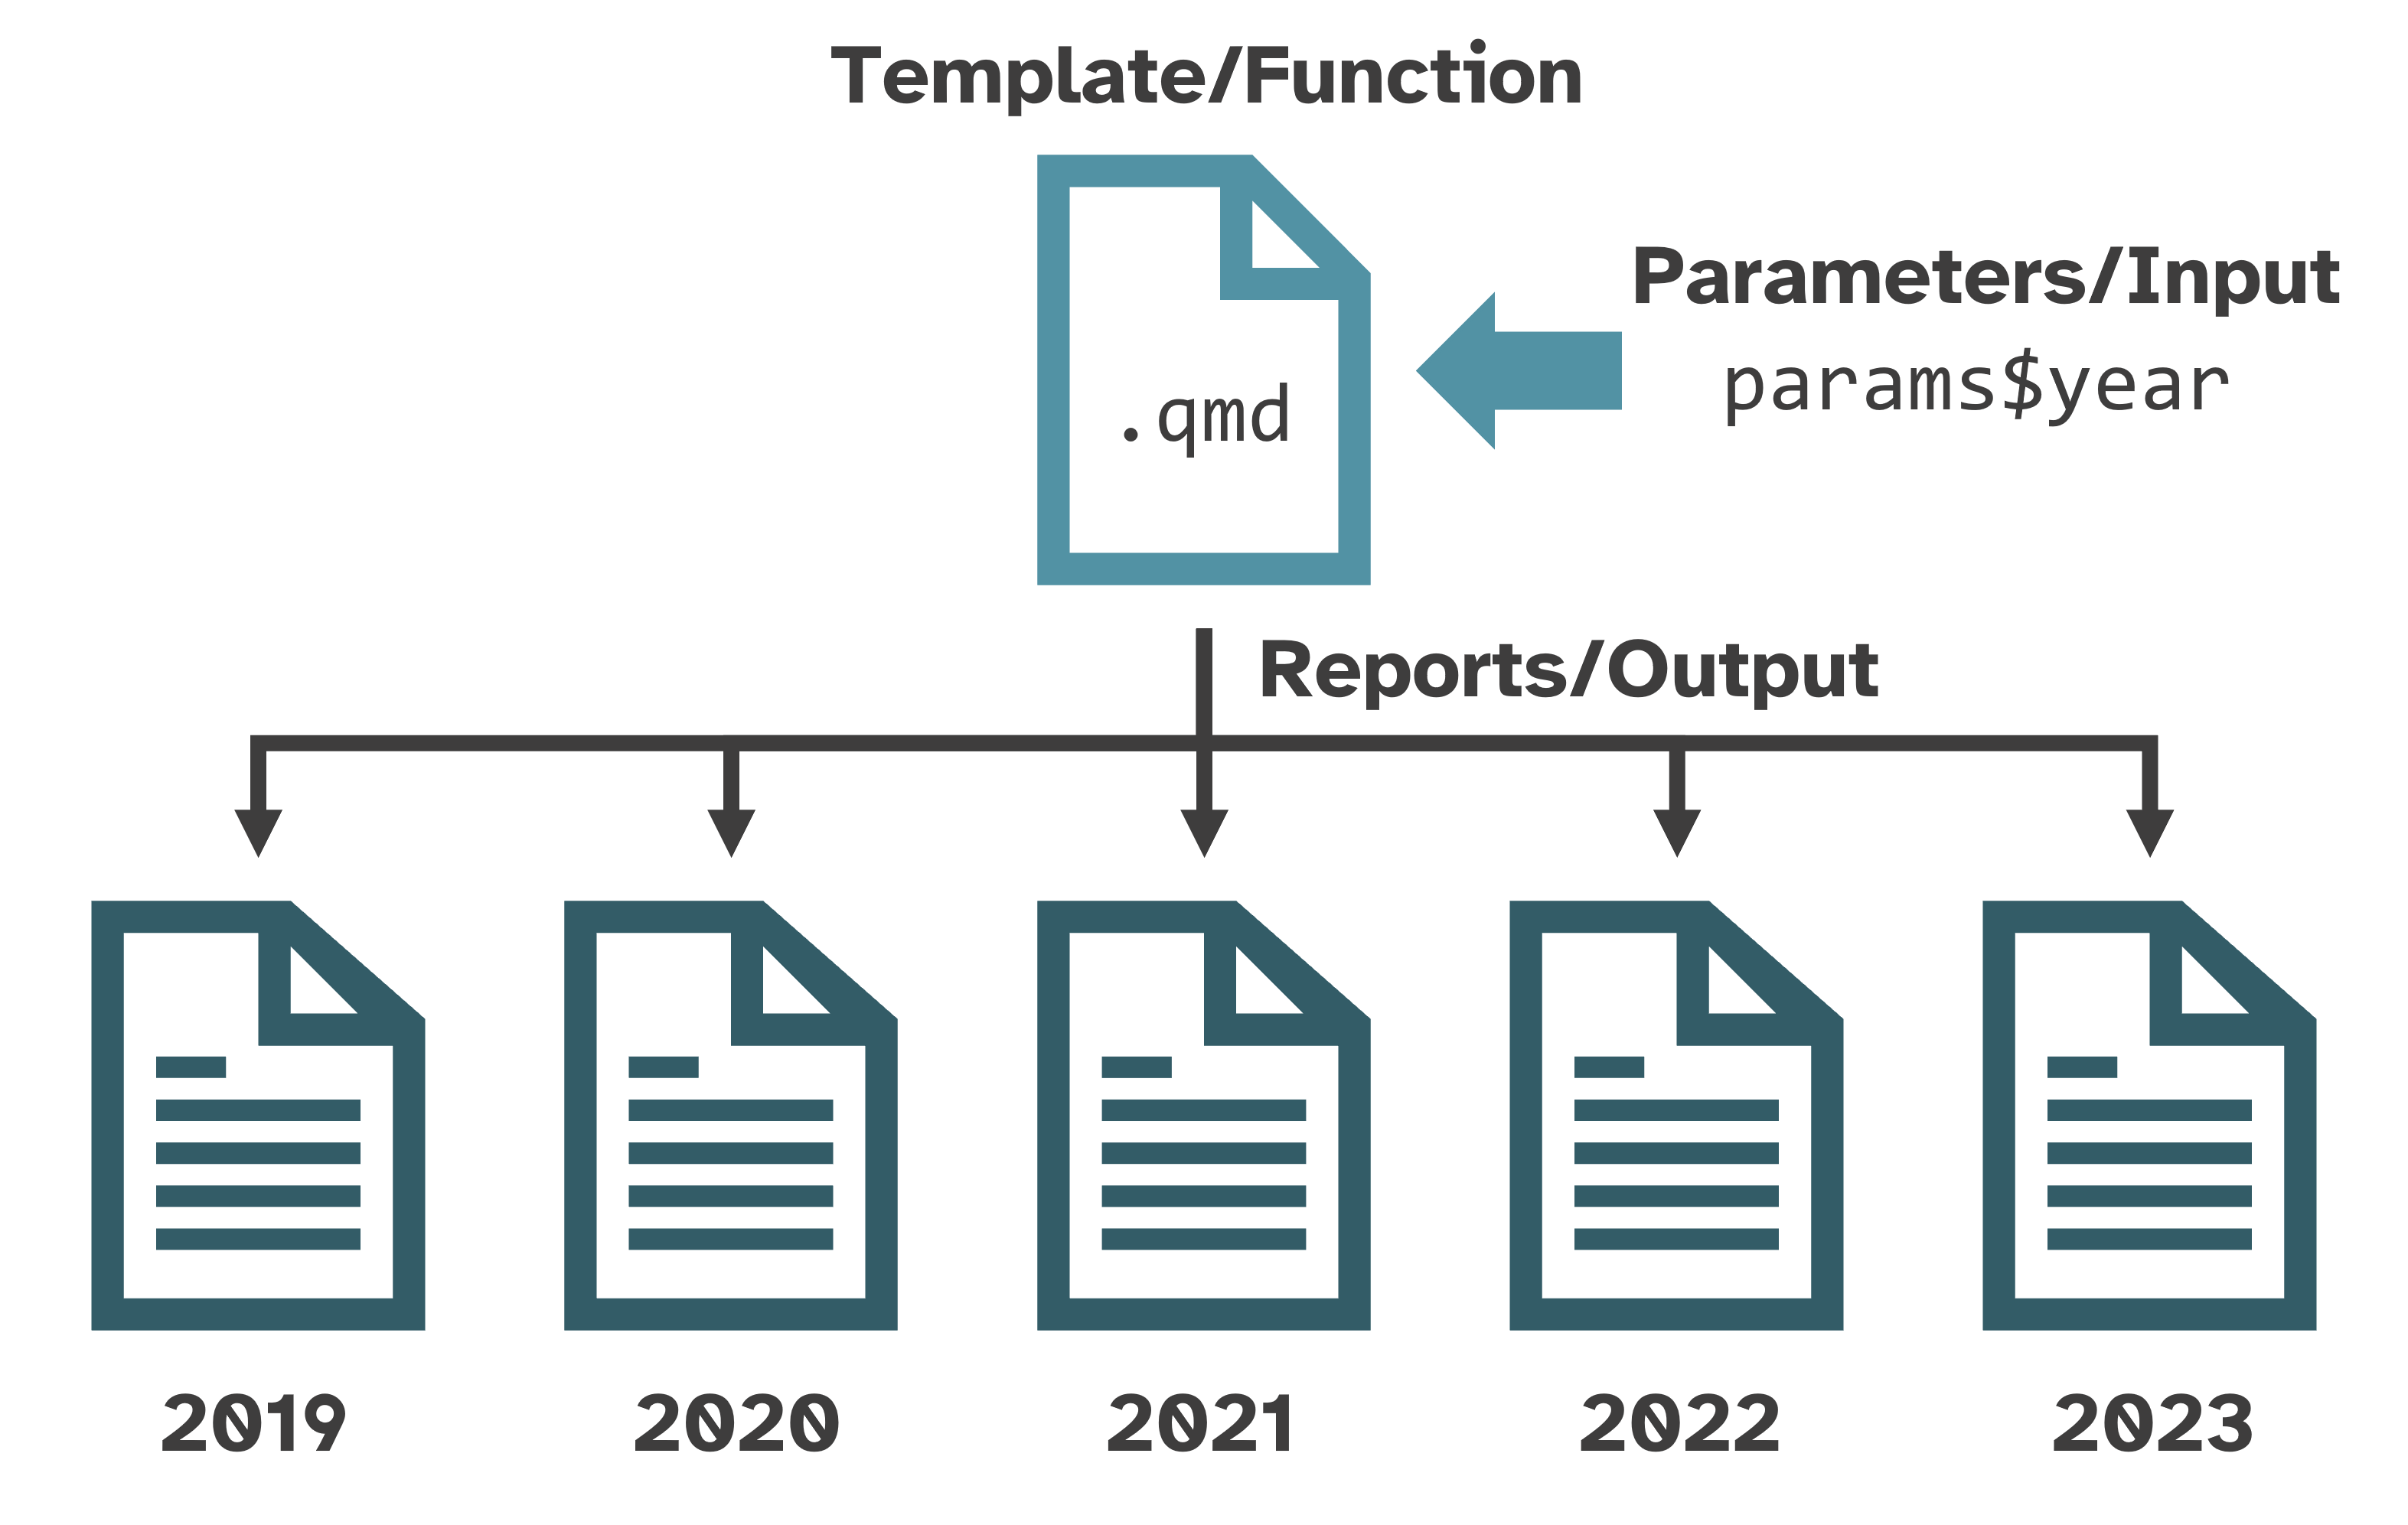
Image from the “R Productive Workflow” by Yan Holtz
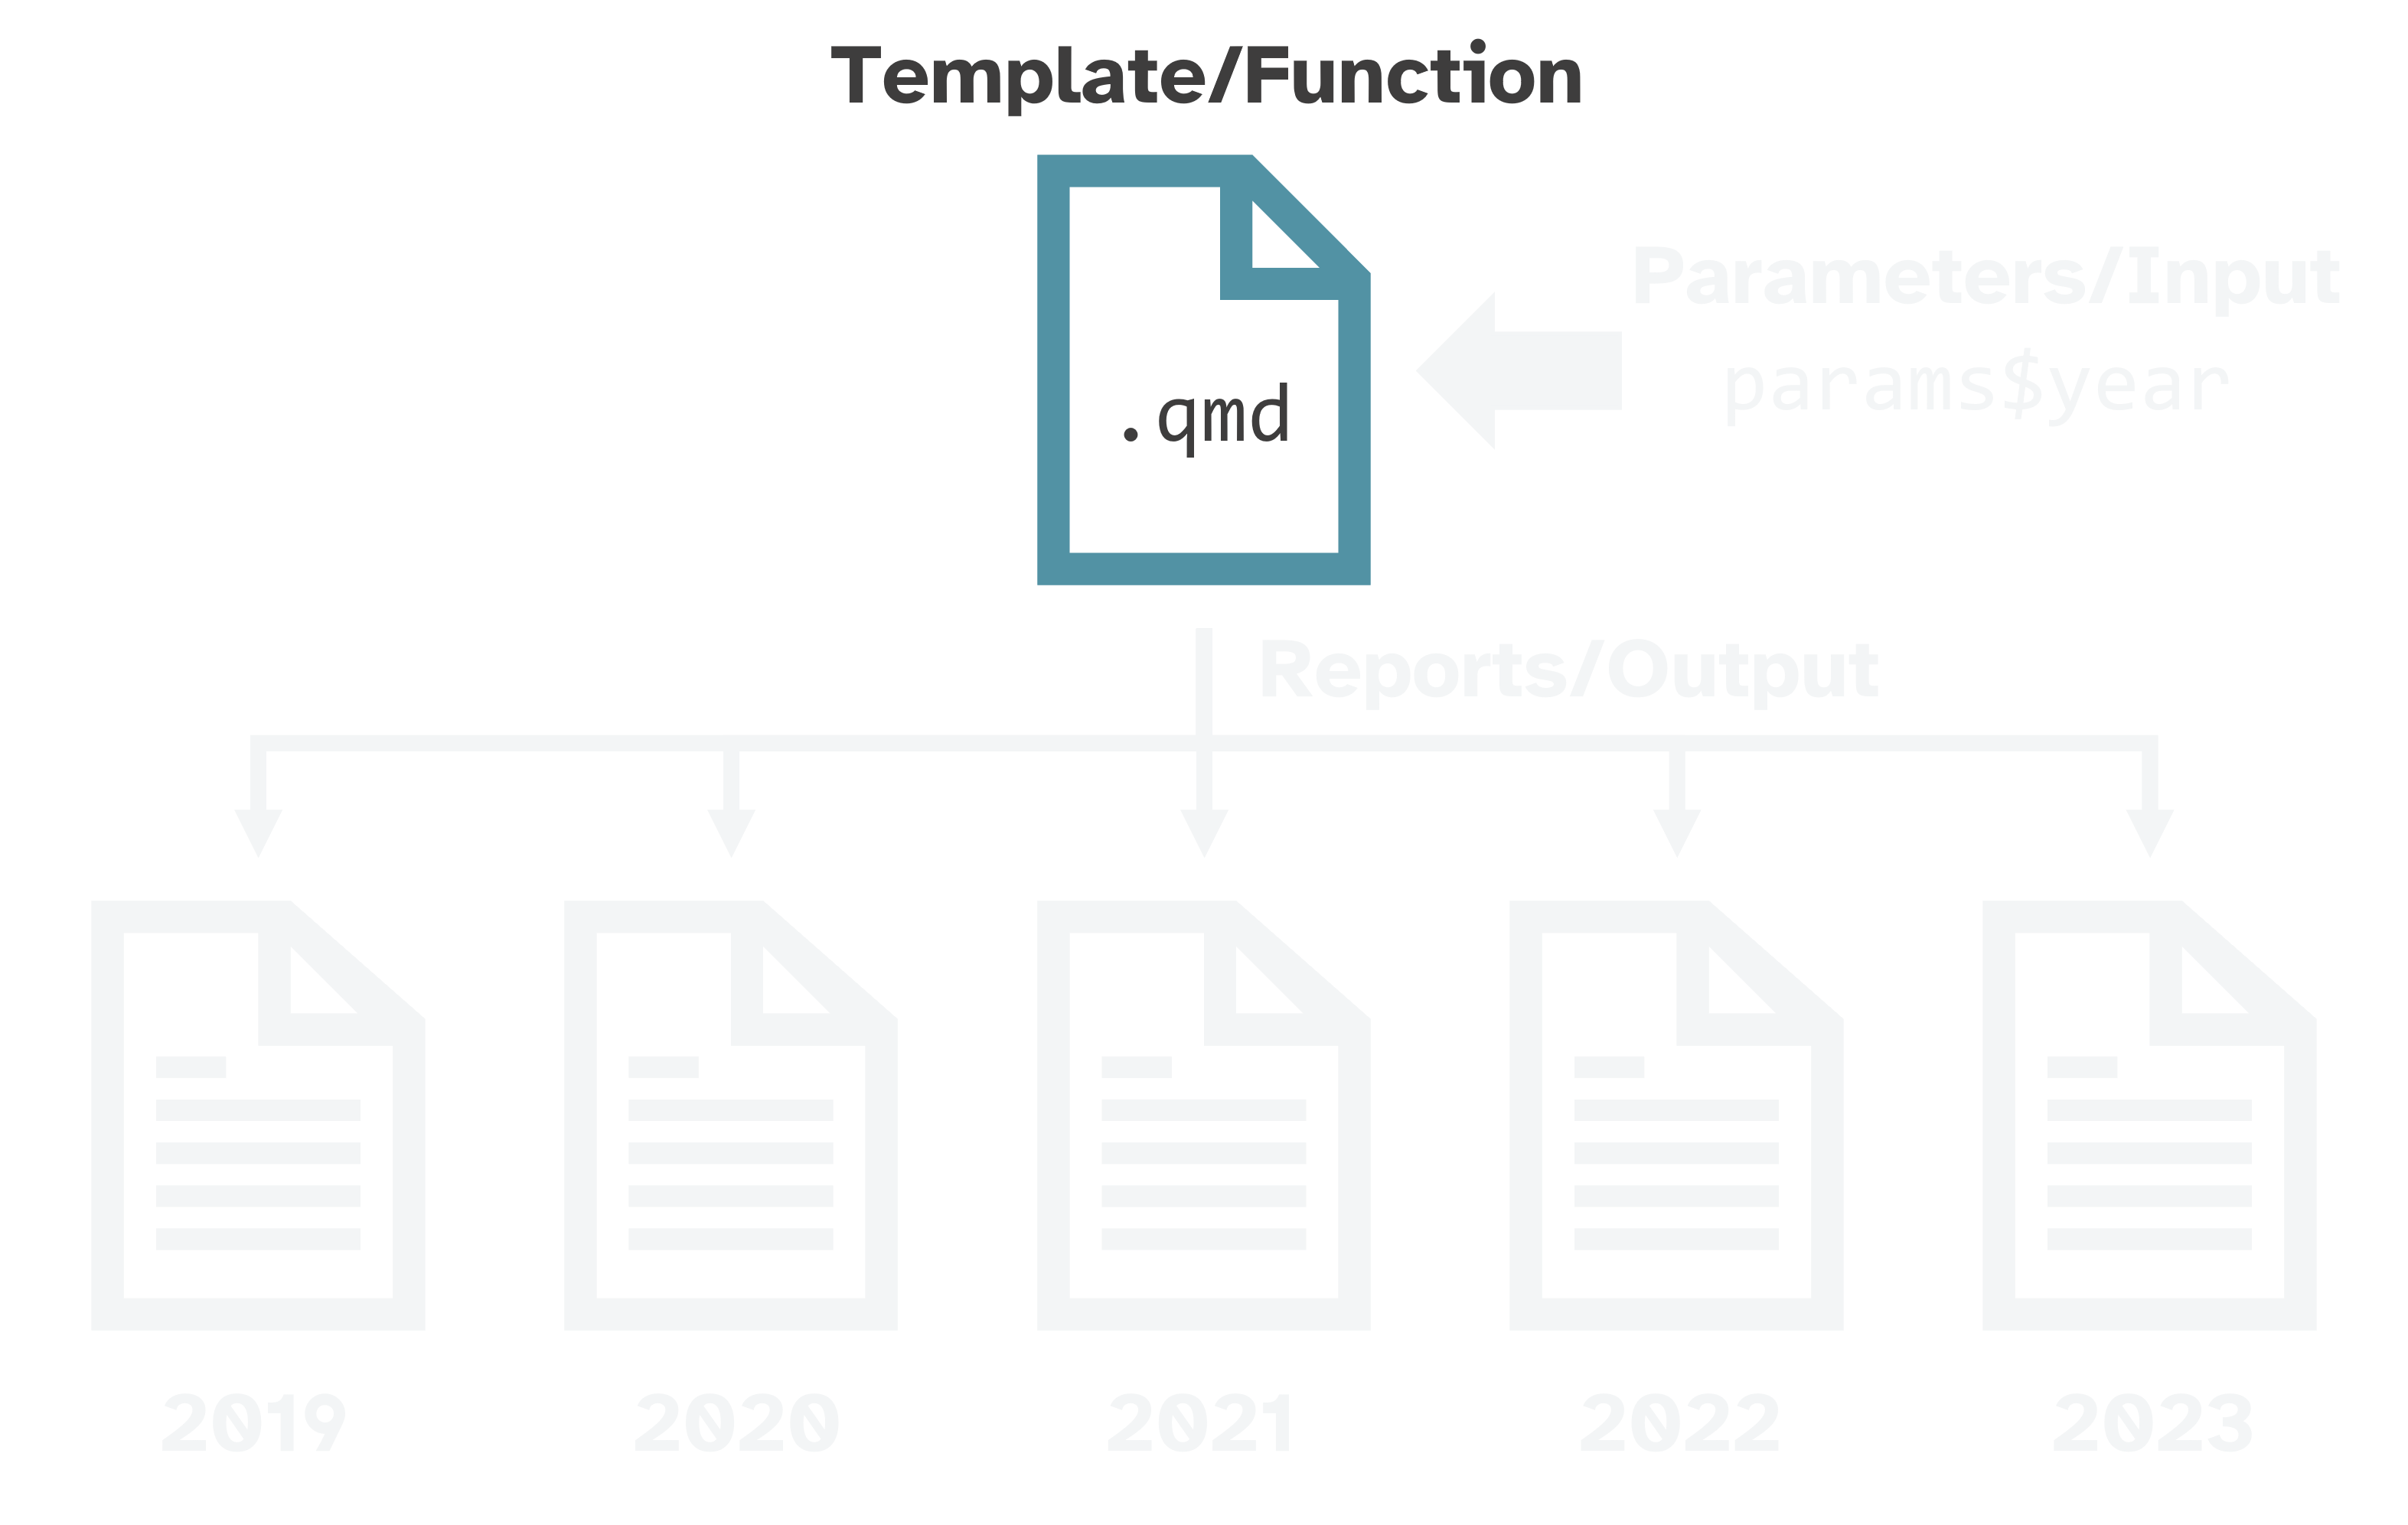
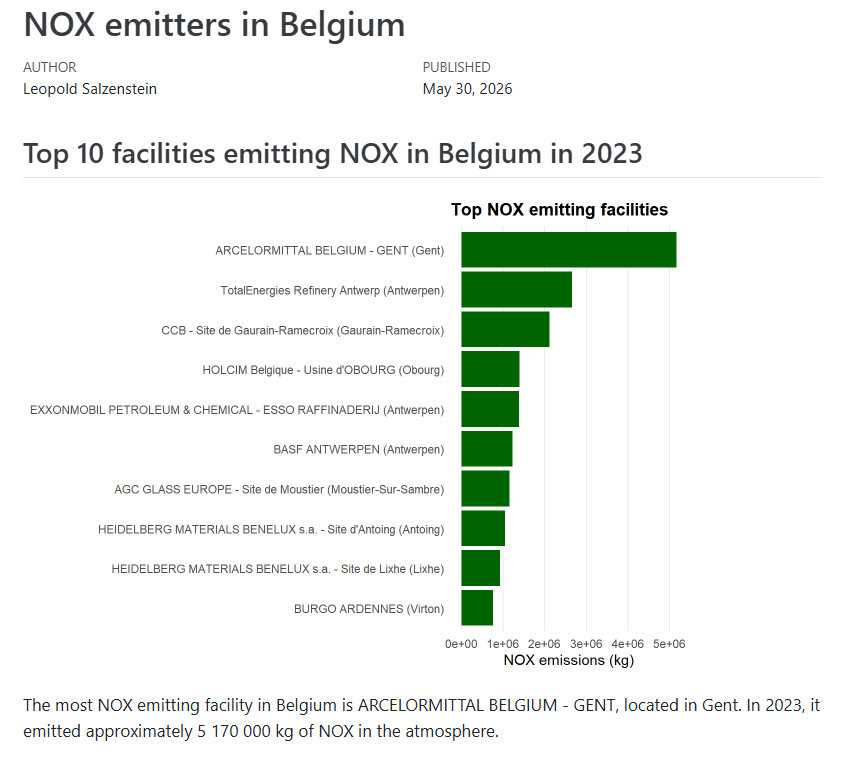
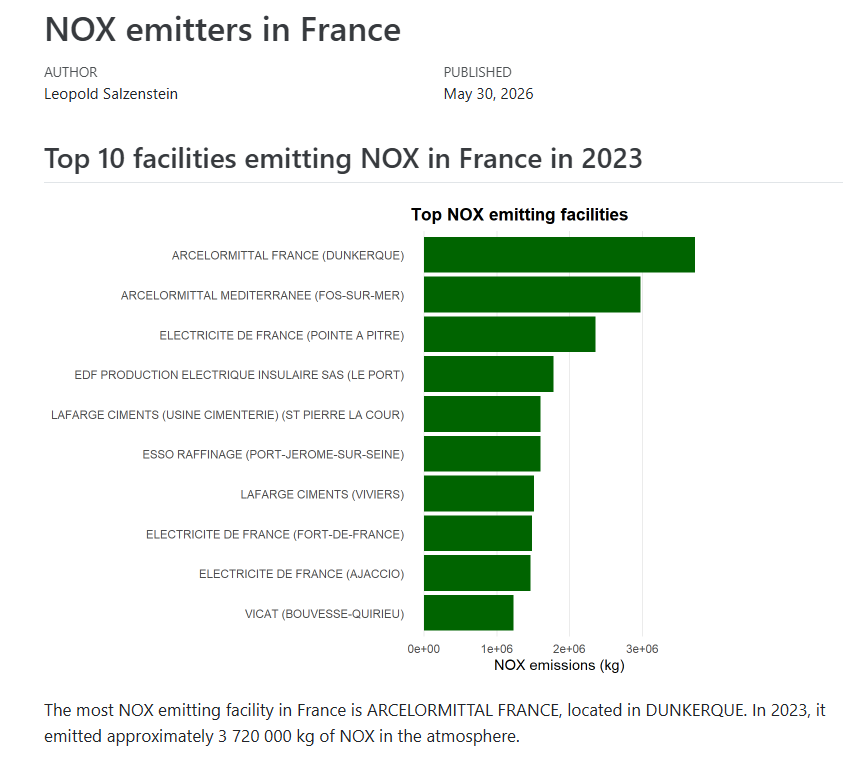
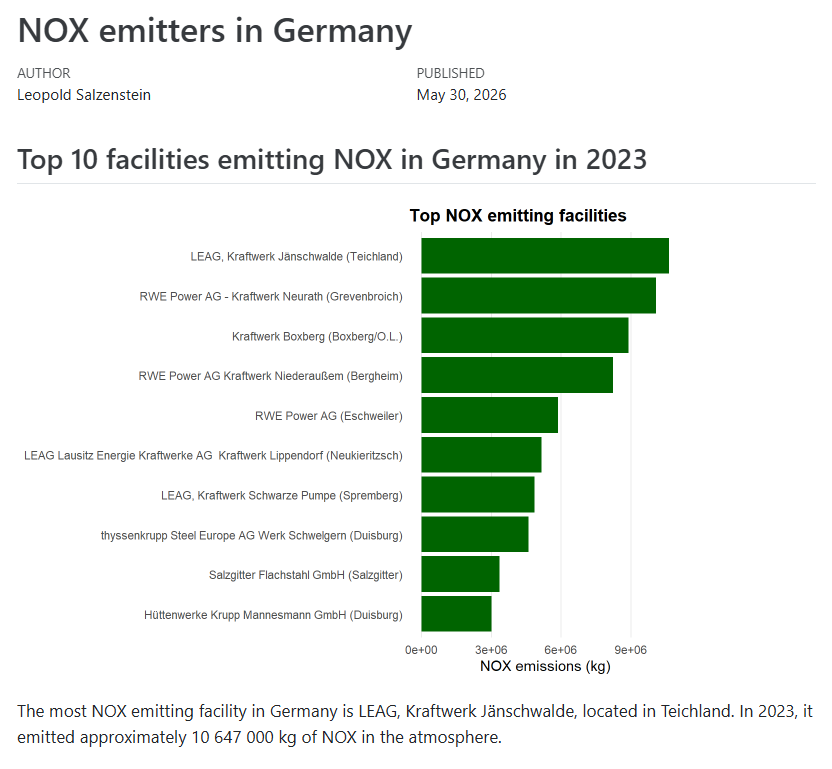
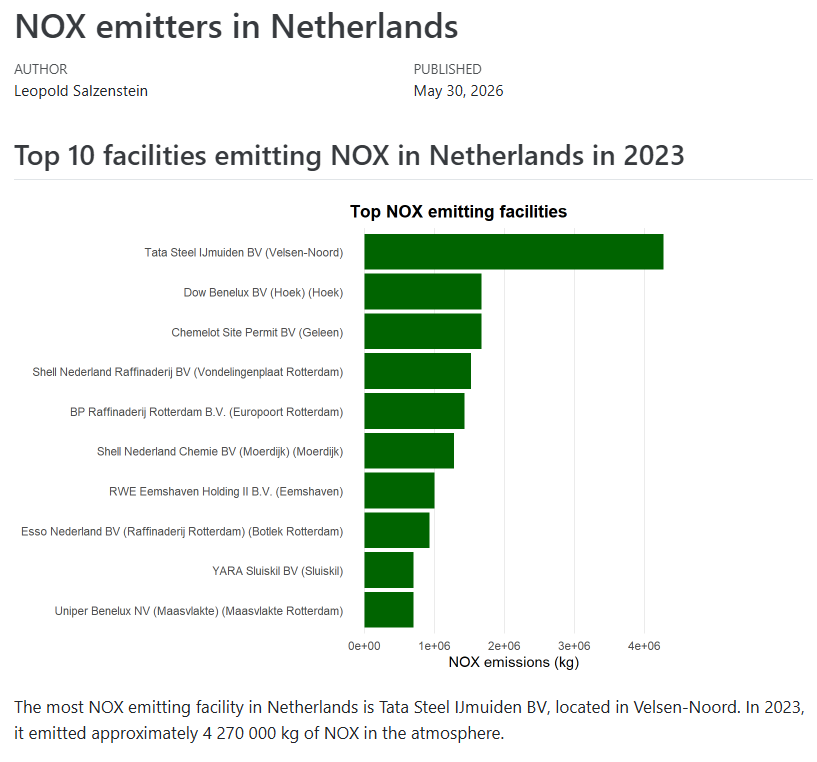
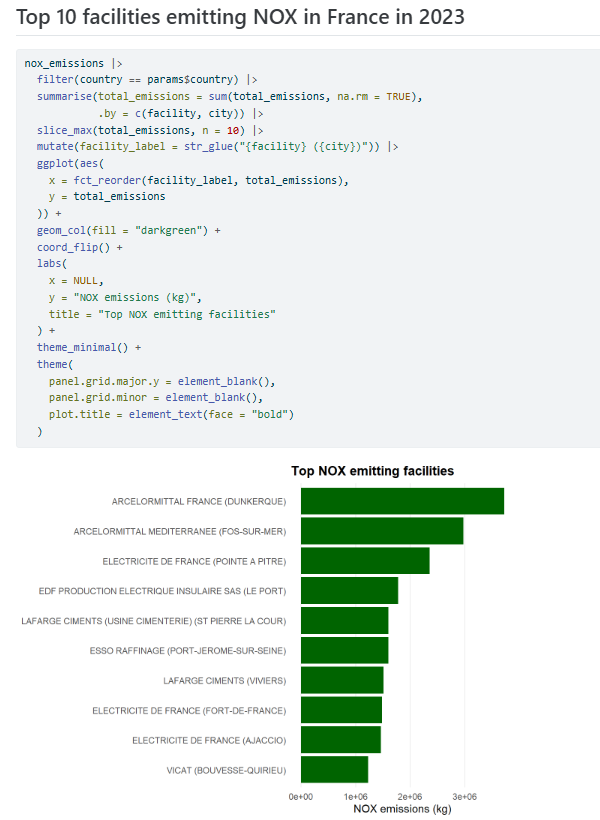
Example: Nitrogen oxides (NOX) emissions
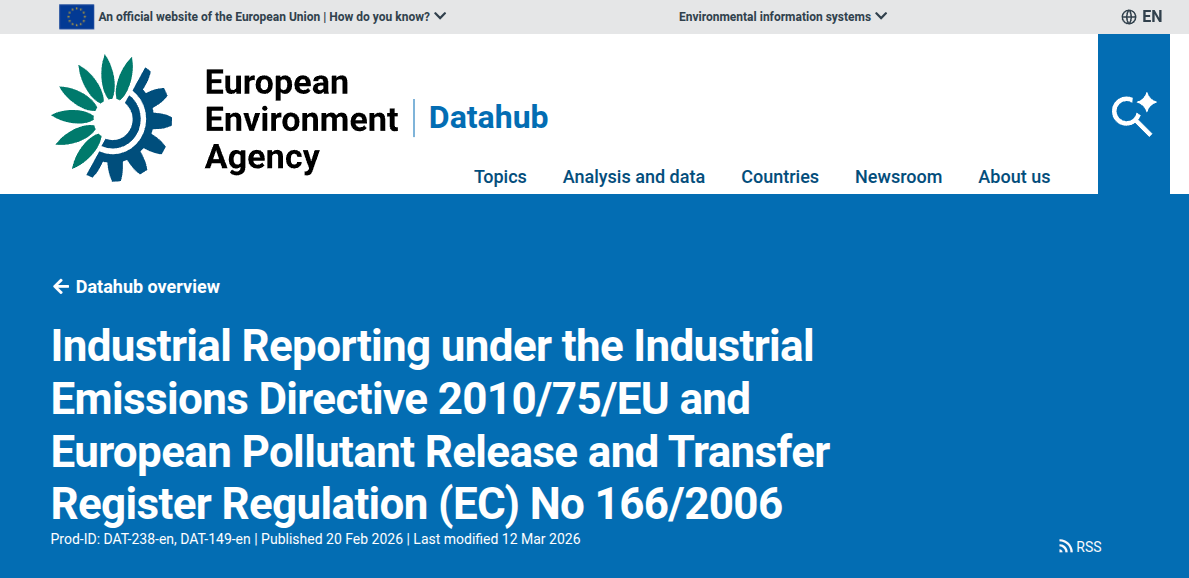
.. in Belgium and its neighbours (NL, DE, FR, LU)
Step 3: render (one report)
Tip: also render some outliers (e.g. countries with little data) to check them.
Step 3: render (several reports)
Step 3: render (several reports)
Step 3: render (several reports)
Step 3: render (several reports)
Bonus #2: render for tech vs non-tech audience
Bonus #2: render for tech vs non-tech audience
Where we are now
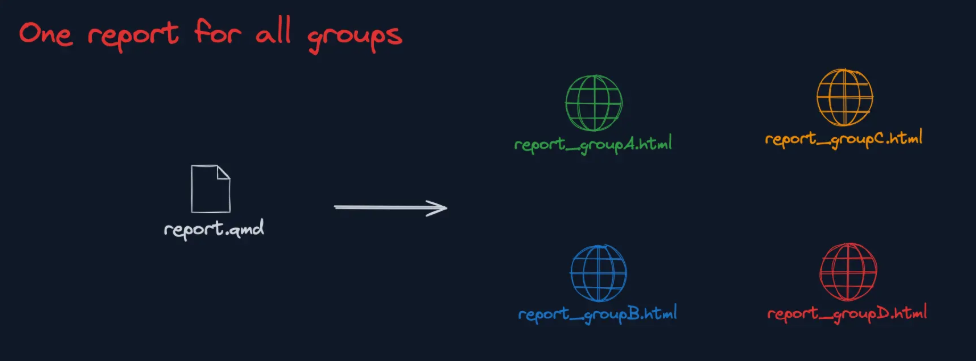
Image from the “R Productive Workflow” by Yan Holtz
Use cases

Questions?